Built in only 19 minutes using five prompts. Follow the same step-by-step process to create your own, then customise every part in seconds with Macaly.
Try it yourself
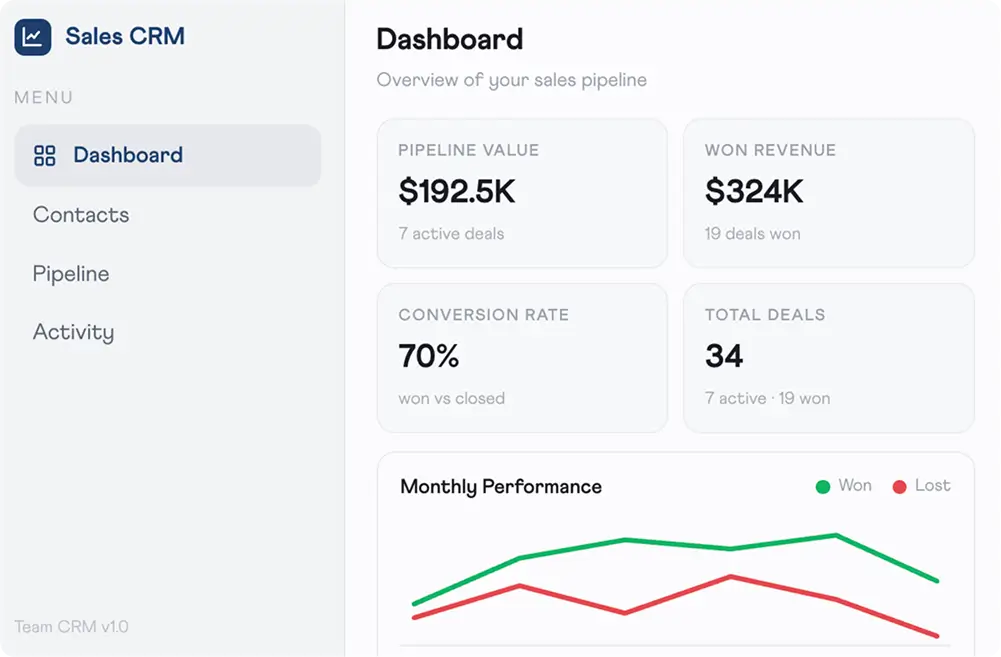
A single prompt generated the entire application — including a dashboard showing pipeline value, revenue won, conversion rate and total deals, alongside a monthly performance chart and dedicated pages for contacts, pipeline and activity. The finished result featured a clean, bright interface with understated navy accents.
“Build me a simple sales CRM for a small team. Dashboard with pipeline value, won revenue, conversion rate and total deals, a monthly performance chart, and pages for contacts, pipeline and activity. Keep it clean and light — no clutter.”
Contacts, deals and notes were linked to a live database, meaning every change was saved instantly and remained available after refreshing the app. Whenever a deal moved through the pipeline, the stage change was also recorded automatically with a timestamp.
“Store contacts and deals in a database. When I move a deal through the pipeline, save the stage change with a timestamp.”
Another prompt added a monthly performance chart that compared won and lost deals over the previous six months. It included clear labels and handled empty datasets gracefully whenever there was nothing to display.
“Add a monthly performance chart that compares won and lost deals over the last six months.”
User authentication was introduced with role-based permissions. Administrators could view every deal, while sales reps only had access to opportunities assigned to them. Sessions were managed automatically, with no additional configuration needed.
“Add login for my team. Admins see all deals, sales reps only their own.”
The final prompt polished the app by making the metric cards consistent, adding keyboard shortcuts for managing the pipeline, and generating 14 automated tests covering the full application. The outcome: zero errors.
“Tidy the dashboard spacing and make the metric cards consistent.”
Pipeline value, revenue won, conversion rate and total deal figures update automatically as opportunities move through each stage of the sales pipeline.
Monitor sales performance over the previous six months with a live monthly chart comparing won and lost deals, eliminating the need to maintain manual spreadsheets.
Administrators have visibility across every deal in the business, while sales reps only see the opportunities assigned to them. Everything is configured from a single prompt, without requiring a separate admin interface.
Calls, notes and pipeline updates are automatically logged against every contact, giving the entire team instant access to a complete history whenever they need it.
A bright, uncluttered design, subtle navy highlights, four core metric cards and a single performance chart keep attention on the information that matters most.
Deal workflows, user permissions and interface rendering were all validated before handover, delivering a dependable, production-ready application.
Describe what you want and Macaly builds it. No coding, no waiting, no developers.
Join the free trial